Research dissertation · PSB Paris School of Business · LRBM

Luxury Beyond Income

How urban middle-class Brazilians desire, access, justify and pay for luxury. A survey of 204 consumers.

Topal Pelegrino, G. & de Oliveira Alves, M. H.  ·  Findings & interpretation, built from the survey data and the Results chapter. Every figure is colour-blind-safe (Okabe-Ito); every number traces to the raw responses; the two flagged gradients are statistically tested.

204
valid respondents
65%
define luxury by quality, not price
58%
pay luxury in installments
8.8%
cite explicit status as a motive
78%
over-stretched, yet say it was “worth it”

The thread running through every finding: for these consumers luxury is a value judgment and an emotional one. It is desired, made accessible through payment, and reconciled after the fact, far more than it is a display of wealth.

III.2.3 · Defining luxury

Luxury is perceived value, not a price tag

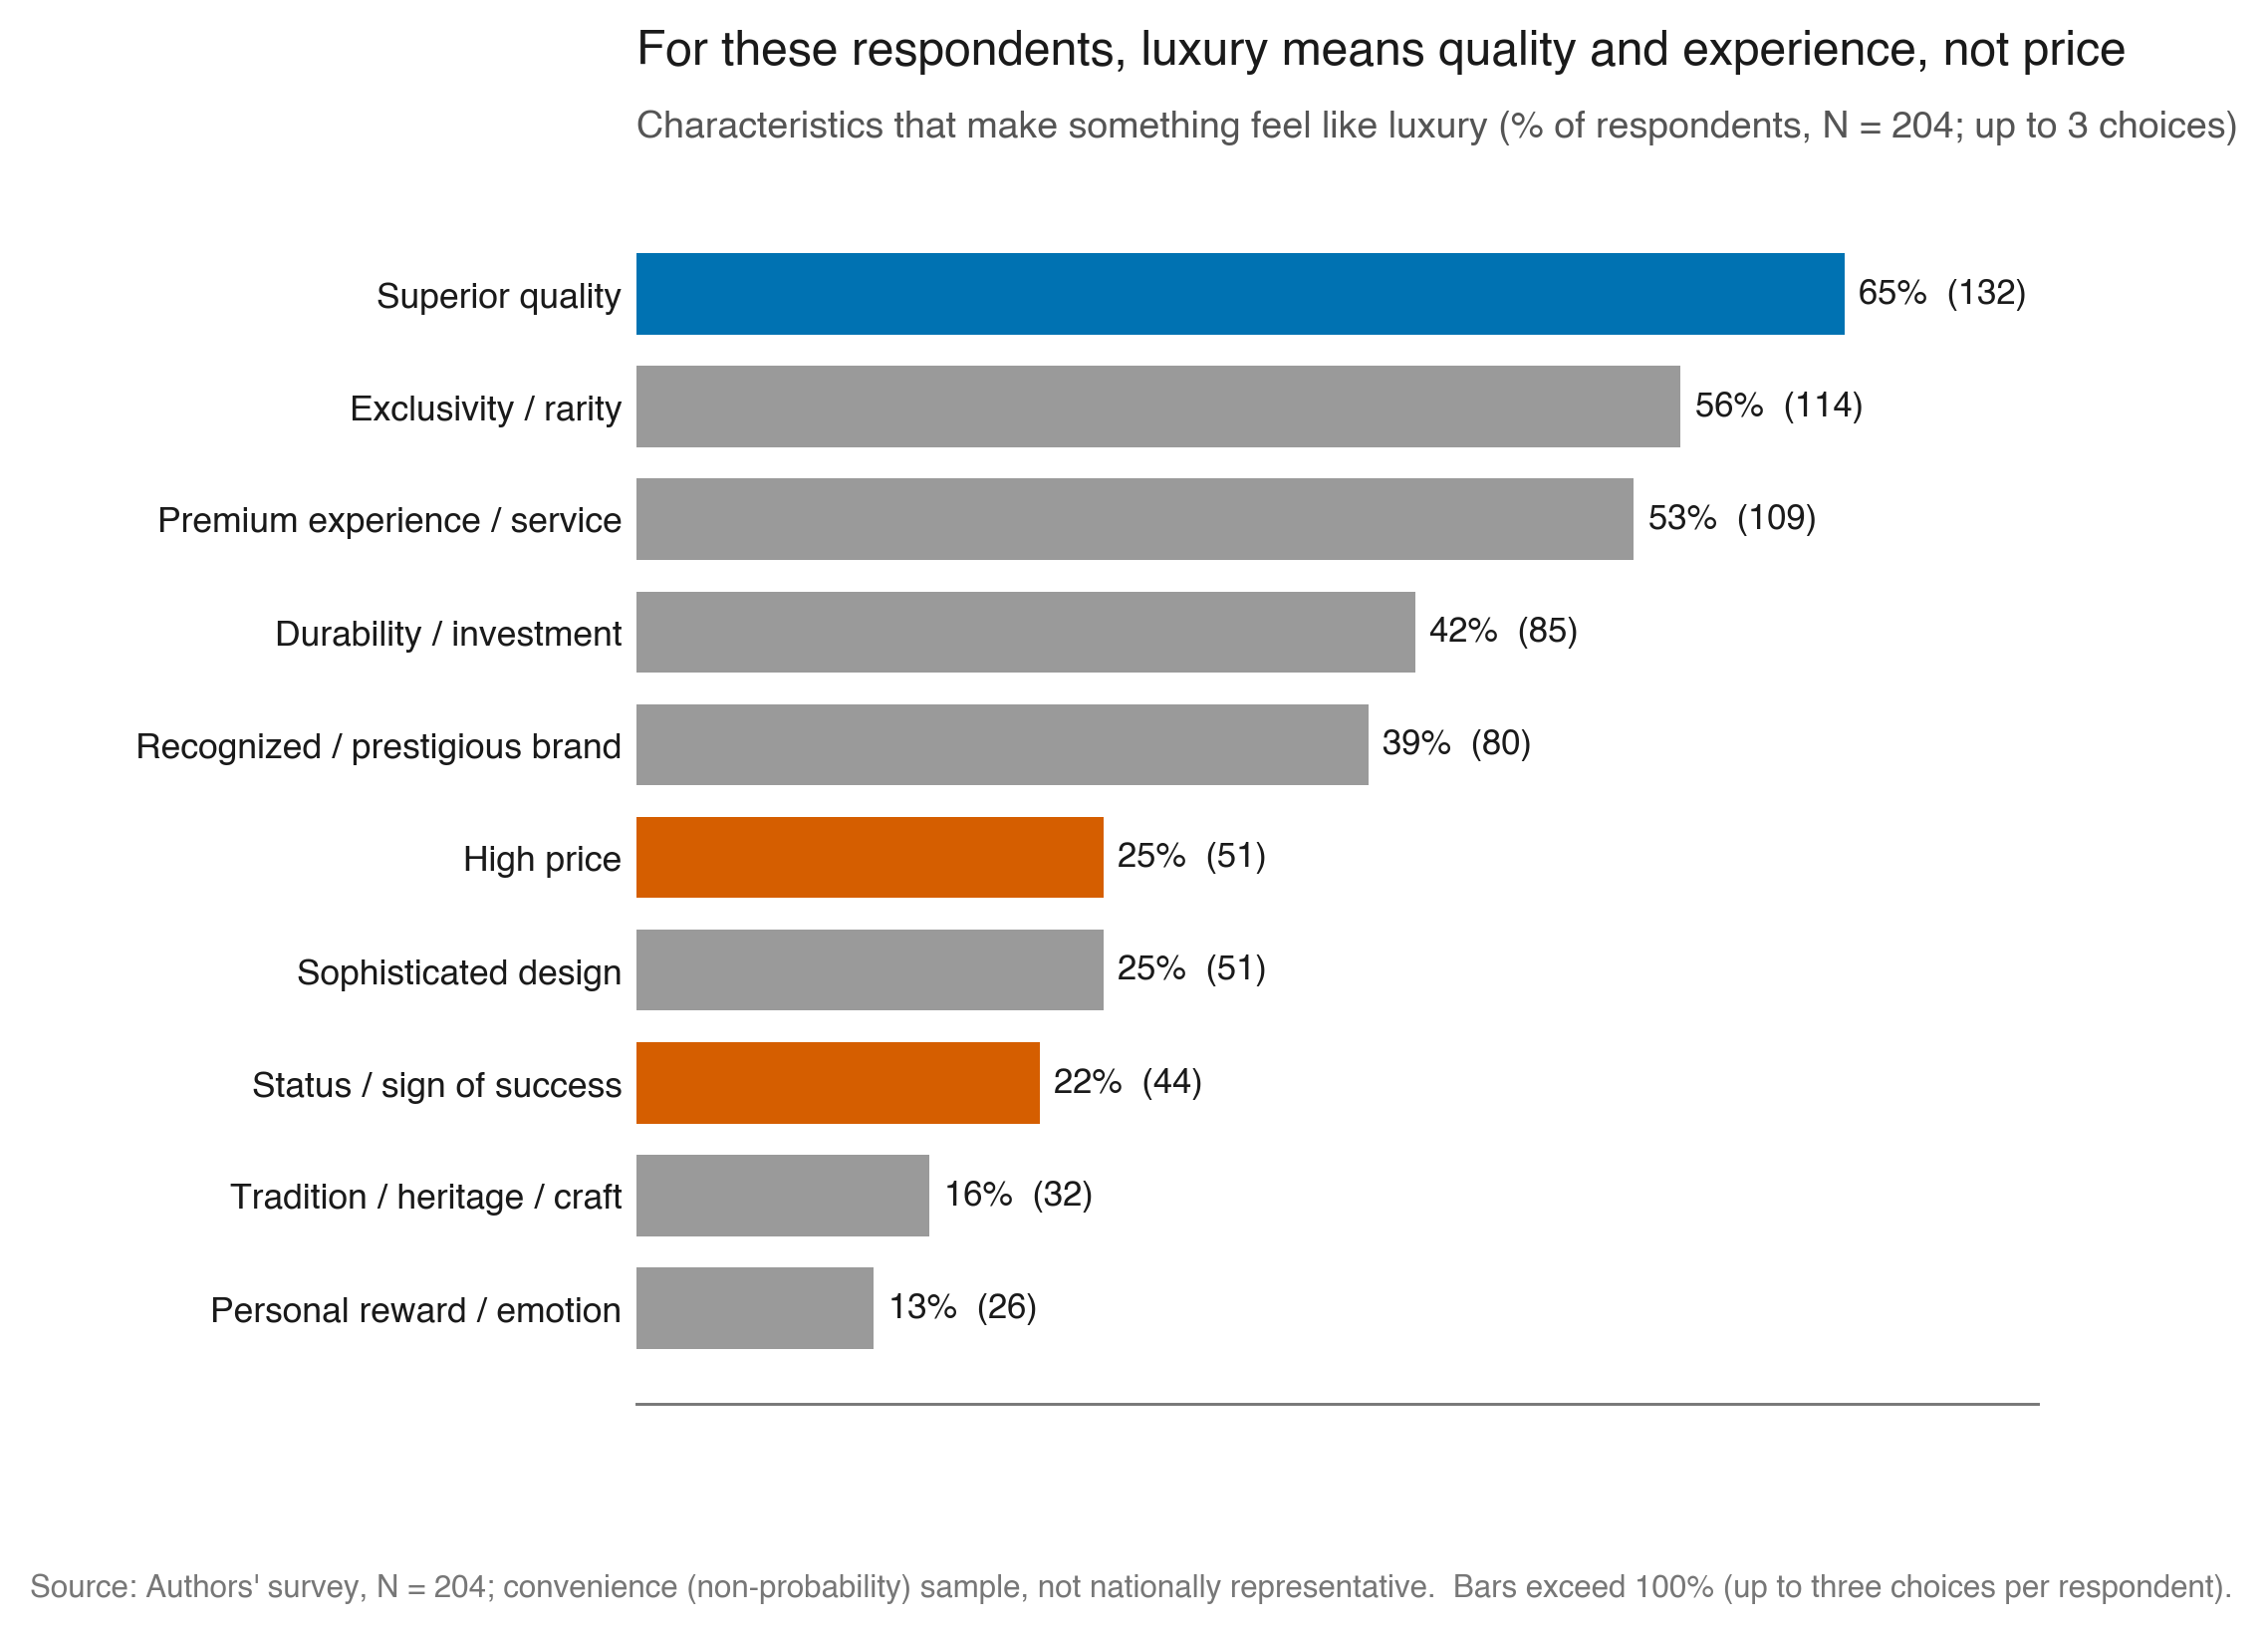
Asked what makes something feel like luxury, respondents chose superior quality (64.7%), premium experience (53.4%) and exclusivity (55.9%) far ahead of high price (25.0%) and status (21.6%).

This reframes the whole dissertation: if luxury is defined by value rather than cost, it cannot be analysed through income alone, which is exactly the gap the study sets out to fill.

In the Results chapter: “respondents do not define luxury primarily as something expensive.” The figure makes the hierarchy visible and ranks the price/status items as the deliberate contrast.
Ranked bar chart of luxury-defining characteristics; superior quality leads at 65%, high price and status trail.
Quality and experience dominate; price and status (vermillion) trail.
III.2.4 / III.2.6 · What & why

Bought for pleasure and quality, rarely for status

The most-consumed category is travel and experiences (64%), not classic hard-luxury goods. The strongest motives are pleasure (70%), quality as investment (69%) and self-reward (39%); explicit status-signalling barely registers at 8.8%.

Emotional and rational justifications travel together: people buy luxury because it feels good and because they can frame it as lasting, high-quality value.

This supports the thesis move from status signalling to symbolic self-expression. Status has not vanished; it has gone underground (see III.2.12 below).
Motivations for luxury; pleasure, quality and self-reward lead, status at 9%.
Pleasure, quality and self-reward lead; explicit status is the lone vermillion bar at 9%.
III.2.7 · Access

Installments are the bridge between aspiration and access

Installment payment is the most common method (58.3%), ahead of cash/debit (21.6%) and credit paid in full (19.6%).

Access to luxury is shaped not only by income but by payment infrastructure: distributing cost over time makes a higher-value purchase feel manageable, Thaler’s mental accounting in everyday practice.

nsPayment method shows no detectable association with purchase frequency or financial tension (χ², V≈0.1), but the test is underpowered (only ~7 “monthly” buyers), so this is “no signal & little power”, not “no effect”.
Payment methods; installments dominate at 58%.
Installments dominate the route to luxury access.
III.2.8 / III.2.9 · Financial reality

Tension is common, occasional, and absorbed by flexible spending

A majority (76%) report at least one purchase beyond what felt financially reasonable, but the typical experience is one or two such purchases, not chronic excess.

When luxury strains the budget, people cut leisure and going out (44%); only 10% cut food and 6% delay bills. Luxury is a managed, discretionary behaviour, not a driver of essential-spending sacrifice.

This refines the original premise of “luxury beyond financial reality”: the phenomenon is occasional financial stretching, not constant overextension.
Distribution of over-stretch purchases; 76% at least one, mostly one or two.
Over-stretch is common (76%) but occasional; the “chronic” tail (vermillion) is tiny.
III.2.10 · The central finding

Financial tension produces justification, not regret

Headline result

Among the 155 respondents who over-stretched, 78.1% still judged the purchase “worth it” at least sometimes.

78.1%121 of 155 · 95% Wilson CI [70.9, 83.9]%. And justification does not fade as over-stretch rises: the decline trend is non-significant (Cochran-Armitage p = 0.56).
The thesis connects this to hedonic justification and deservingness (Okada 2005; Kivetz & Simonson 2002) and mental accounting (Thaler 1985): a purchase that is emotionally satisfying and framed as quality becomes easier to reconcile after the fact. Tested, not just observed.
Worth-it rate by number of over-stretch purchases; ~78% overall, stable across levels.
Justification holds across tension levels; the 4–6 and 7+ bars rest on small bases (greyed). Association, not causation.
III.2.11 · Desire formation

Social media builds desire long before it triggers a purchase

62% say social media makes them want a specific luxury item at least sometimes, yet only 10% name it as a direct purchase trigger. It works cumulatively, shaping aspiration rather than prompting checkout.

Statistically significant
79%→35%Digital influence falls monotonically with age (18–24 → 55+). Cochran-Armitage trend p = 0.0001, Spearman ρ = −0.26, power 0.88, FDR-adjusted p = 0.014.
Supports the thesis reading of luxury desire as increasingly mediated by digital culture, especially for younger urban consumers (Pangarkar & Shukla 2023).
Line chart; social-media influence declines with age from 79% to 35%.
A steady, statistically significant decline with age.
III.2.12 · Status, hidden

Status hides in plain sight

Only 8.8% admit buying luxury to signal status. Yet the more a respondent compares themselves to others, the more they select symbolic motives (confidence, identity, status, fitting in): from 23% (never) to 62% (frequently).

Statistically significant
p = 0.0003Cochran-Armitage trend; Spearman ρ = +0.26, Cramér’s V = 0.26 (power 0.88), FDR-adjusted p = 0.014. The gradient is real, not noise.
This is the dissertation’s most original move: it updates Veblen’s conspicuous consumption for the contemporary middle class. Status operates indirectly, through identity and confidence, rather than open display.
Bar chart; symbolic motivation rises with declared comparison, 23% to 62%.
Symbolic motivation rises with declared comparison (n=1 cell excluded). Association, not causation.
III.2.13 · Plural luxury

Different luxuries are bought for different reasons

Travel and beauty skew to pleasure and self-reward; technology and home skew to quality and durability; identity peaks for clothing. Across every category, explicit status stays at or below 19%.

Luxury is plural and context-dependent: a single behavioural model cannot capture it, which is why the thesis analyses motivation category by category.

A status-by-category test confirms what the eye sees: explicit status motivation does not differ meaningfully across categories; it is uniformly low.
Heatmap of motivation share within each luxury category.
Motivation profile by category; starred rows have small bases (n<30).
The inferential layer

What the statistics add to the cross-tabulations

The Results chapter reports the cross-tabulations descriptively. The tests below put numbers on whether each pattern is stronger than sampling noise within this sample, using chi-square and Cochran-Armitage trend tests, Cramér’s V, Spearman, and a Benjamini-Hochberg correction across the five confirmatory tests.

Thesis argumentTestEffect / trendp (FDR)Verdict
III.2.12 · comparison → symbolic motiveCochran-Armitage trendρ=0.26 · V=0.260.014significant
III.2.11 · age → social-media influenceCochran-Armitage trendρ=−0.26 · V=0.270.014significant
III.2.10 · justification declines with tension?Cochran-Armitage trendM²=0.340.36no decline (good)
III.2.8 · over-stretch × paymentχ² of independenceV=0.14 · power 0.340.36null, underpowered
III.2.7 · frequency × paymentχ² of independenceV=0.10 · power 0.110.93null, underpowered

A multivariate logistic model of “worth it” (the 155 stretched respondents) finds no single dominant predictor (pseudo-R² = 0.04): justification is diffuse rather than driven by one factor. Both the headline proportion and the two gradients were independently reproduced from the raw Excel by an adversarial statistician review.

Read with care

What this sample can and cannot say

  • Convenience (non-probability) sample. 204 respondents recruited online, skewing young (nearly half aged 25–34) and toward the Center-South cities, as the map shows. The findings describe these consumers, not Brazil as a whole.
  • Associations, not causation. The gradients are correlational; the design cannot establish what causes what.
  • Self-report. Motives like status are socially sensitive and may be under-declared, which is precisely why the indirect “status hides in plain sight” result matters.
  • Underpowered sub-tests. Payment cross-tabs have too few “monthly” buyers to detect a relationship even if one exists.
Choropleth map of Brazil; respondents span the country but cluster in the Center-South, darkest in São Paulo.
Where respondents are from. Darker = more respondents, grey = none. Spread across Brazil but concentrated in the Center-South; 187/204 located to a state (13 abroad), via fuzzy-matching to the IBGE municipality list.